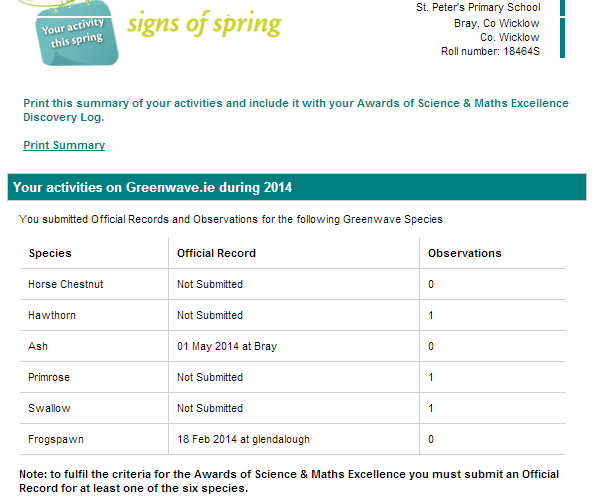
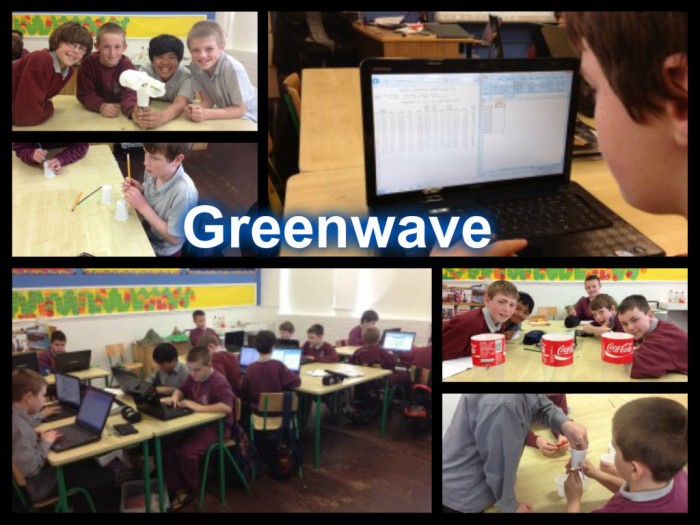
We’ve been working hard to record our signs of Spring using Greenwave. We really missed Mr Curran who retired last year as he’s always brilliant for noticing the signs of Spring! Here’s our dashboard:
Some of the classes have been following the weather forecast during News2day on the RTE player and discussing what the meteorological terms mean.
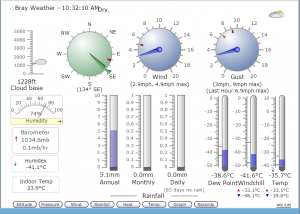
We also studied a great website Bray Weather to look at the local weather.
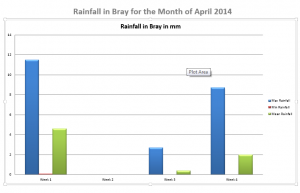
We’ve been learning a lot about the mean, the mode and the range of data in Maths so we recorded some of the rainfall readings onto graphs to see what they looked like as bar charts.
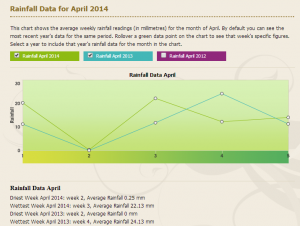
We also compared this year’s weather with previous years to see how they were similar and different – putting our skills in reading data to the test. We found that the rainfall was fairly similar but that it was warmer on average last year.
Check out our work on homemade weather instruments and recording data!
Check out our other work on Discover Primary Science 2014 here!


